构件:与介质正交的那一层
图示与数据图不属于任何一格——同一张架构图可以出现在幻灯里、 文档里、网页里。所以它们单列一层,共 52 型:图示 27 型 + 数据图 25 型。
每一型写明什么时候该用它与画法约定。
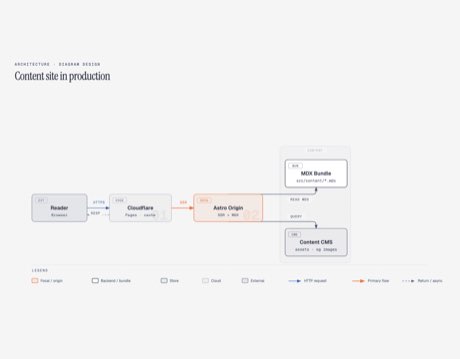 图示
图示Architecture
system overviews, data-flow diagrams, integration maps, infra topology
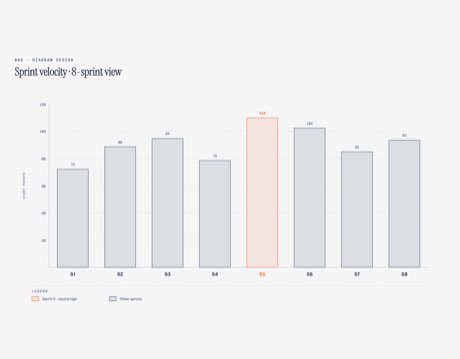 图示
图示Bar / Column Chart
comparing discrete quantities across categories or time intervals — sprint velocity, monthly revenue, feature adoption, cohort counts. Use when each category has a single numeric value and the comparison between bars is the primary message
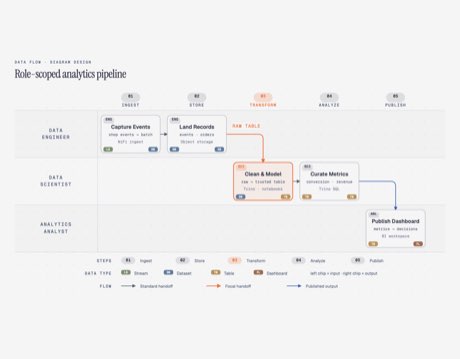 图示
图示Data Flow
visualising how data moves through a pipeline *across organisational roles* — who initiates, who processes, who publishes, and who consumes. The canonical use case is a multi-role data platform (Admin → Engineers → Scientists → Consumers) with 4–6 process steps. Use when the reader needs to understand who does what at each stage, not just the technical components
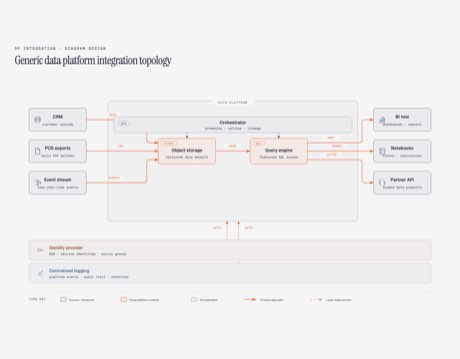 图示
图示DP integration
the integration topology of a data platform — which source systems plug in, which consumer surfaces plug out, and which protocol each one speaks. Hub-and-spoke layout wrapped in an explicit Data platform layer; no time/phase axis
 图示
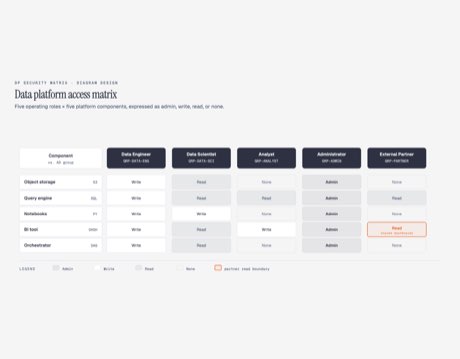
图示DP security matrix
documenting per-role / per-component access permissions for a data platform — a grid where each row is a platform component (Keycloak, MinIO bucket, Trino catalog, JupyterHub, NiFi, …) and each column is a role / AD group (Data Administrators, Data Engineers, Data Scientists, Data Consumers, …). Each intersection cell holds a permission value (Admin / Full / R/W / Read / SELECT / Login / No access) with a visual category that matches the permission level. One cell may be marked focal to flag a critical access rule (e.g., "Data Consumers can ONLY `SELECT` from the aggregated catalog — sole consumer access")
 图示
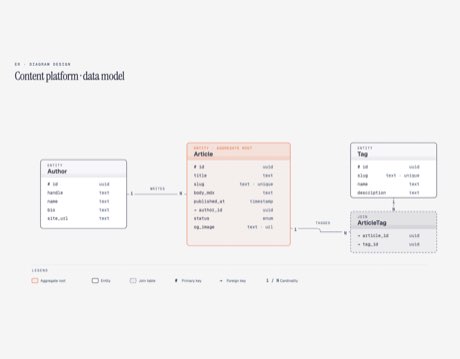
图示ER / Data Model
database schemas, API resource relationships, domain models
 图示
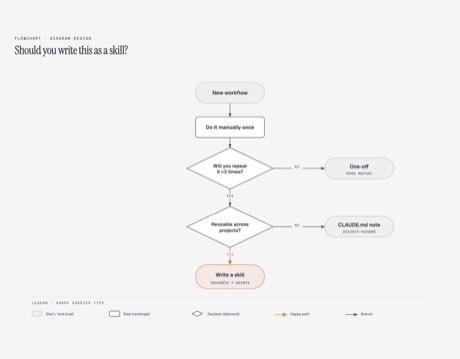
图示Flowchart
decision logic, algorithms, user-facing branching flows ("Should I…?"), onboarding routing, support-triage trees
 图示
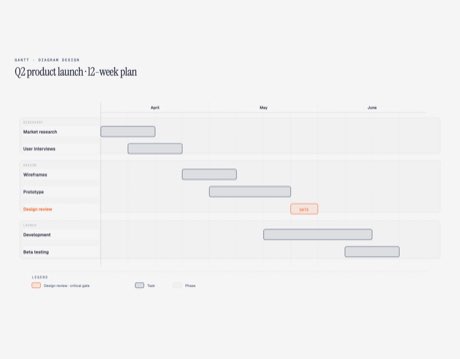
图示Gantt Chart
project plans and roadmaps — tasks with explicit start and end dates, grouped into phases. Use when the reader needs to see temporal overlap, parallel tracks, and milestone sequencing at a glance
 图示
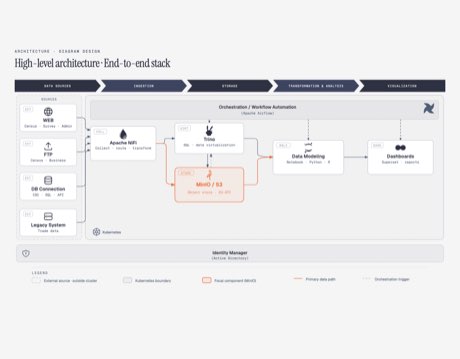
图示High-Level
end-to-end data stack overviews — ingestion → storage → query → analytics → visualization — deployed on a container orchestrator (Kubernetes, ECS, Nomad). Combines a phase chevron banner, deployment boundary, orchestration bar, identity footer, and (optionally) a right-side vertical chevron strip for cross-cutting concerns (Orchestration, Security, Observability)
 图示
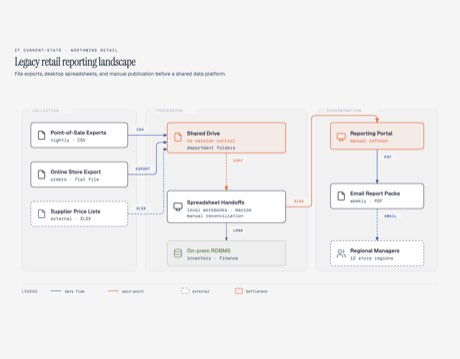
图示IT current-state
documenting the *before* picture of a modernization proposal — the legacy IT landscape grouped by phase or department (Collection → Processing → Dissemination, or Frontend / Backend / Storage, or Survey → Analysts → Reports), with pain-points flagged, file-based hand-offs labelled (CSV / Excel / Email / Copy), and pre-platform tooling visible. The companion to `type-dp-integration.md`: this type shows the gap that a data-platform proposal is going to close
 图示
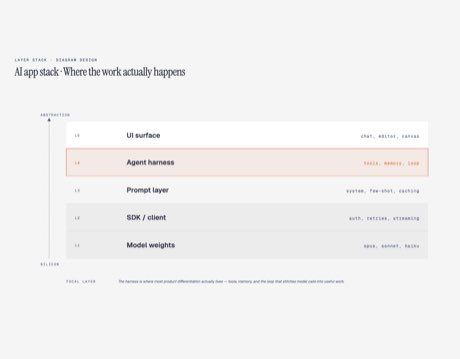
图示Layer Stack
OSI model, CSS cascade, context hierarchy, tech stack, abstraction layers, memory hierarchy
 图示
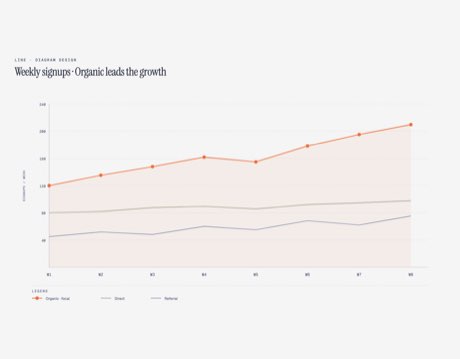
图示Line Chart
continuous trends over time or a sequential index — signups over weeks, revenue by month, latency over releases. Use when the direction and rate of change between points is the primary message
 图示
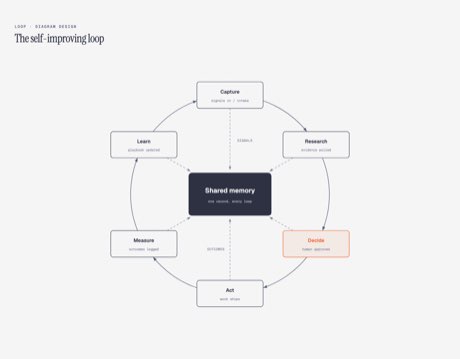
图示Loop
reinforcing cycles, flywheels, feedback loops, and operating loops — anything where the last step feeds the first and a shared hub accumulates state. Use Loop when the reader must see both motions at once: work advances clockwise around the ring, while each pass writes durable state back to one common center
 图示
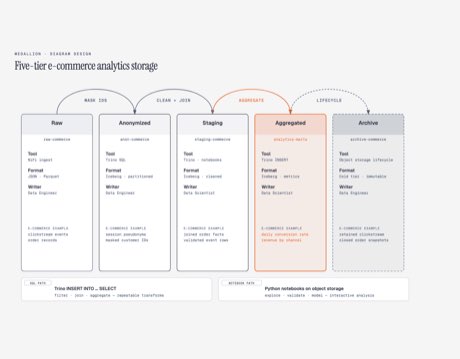
图示Medallion
documenting a multi-tier data-storage layout where each tier is a distinct *quality / access level* of the same dataset — typically raw landing zone, anonymised, staging/cleaned, aggregated business indicators, and cold archive. Used when the reader needs to see at a glance *what each bucket contains*, *who writes it*, *with what tool and format*, and *how data is promoted between tiers*
 图示
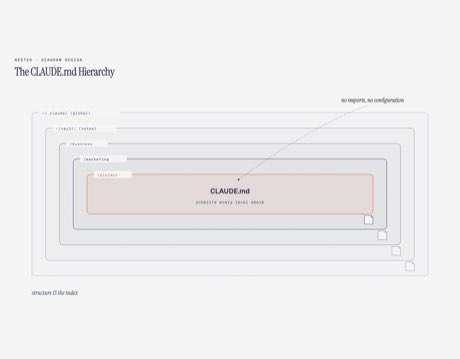
图示Nested Containment
hierarchy through containment — scope boundaries, CLAUDE.md cascade, trust zones, folder nesting, blast radius. Outer = broader, inner = more specific
 图示
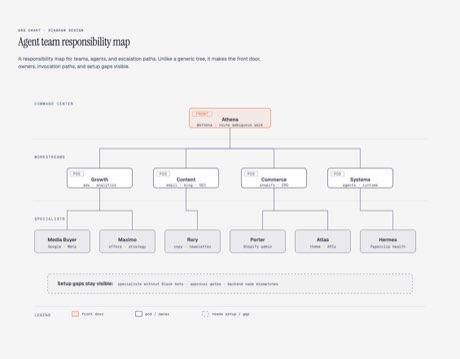
图示Org Chart / Responsibility Map
human teams, agent teams, support escalation maps, role ownership, routing maps, and any hierarchy where the reader needs to know *who owns what* rather than just parent → child structure
 图示
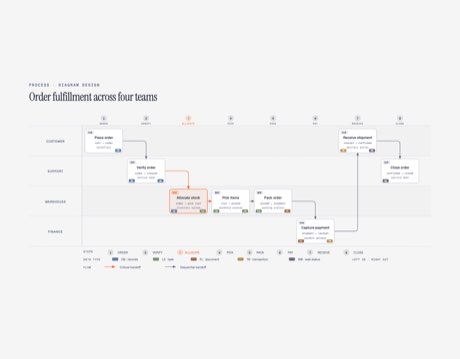
图示Process
sequential business processes with multiple actors/divisions where the reader needs to see *who* does *what*, *what data* enters and leaves each step, and *which tools* are used — not just the step order. Covers responsibility audits, data-quality gate reviews, cross-divisional handoff maps, and end-to-end workflow documentation
 图示
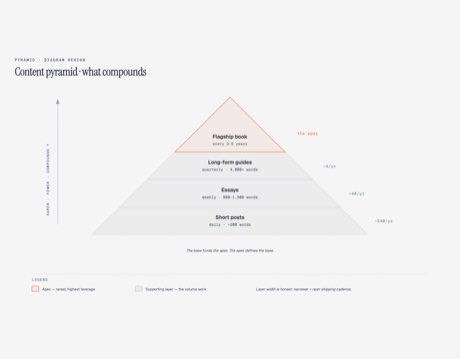
图示Pyramid / Funnel
hierarchy of needs, prioritization ranks, value pyramids, conversion funnels, content importance stacks
 图示
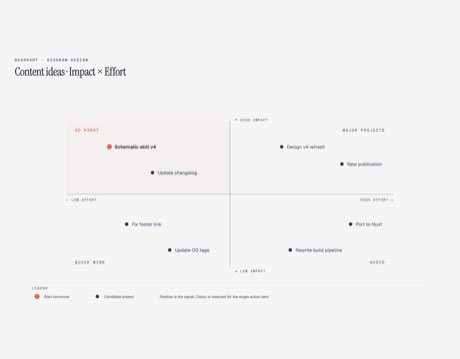
图示Quadrant
prioritization (Impact × Effort), positioning (Reach × Frequency), portfolio maps, 2×2 decision frames
 图示
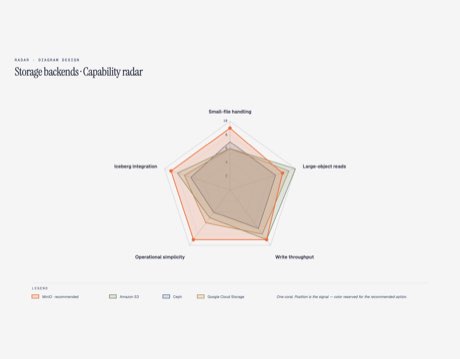
图示Radar / Spider
comparing 3–5 entities across 3–5 quantitative criteria on a single normalized 0–N scale. Capability matrices, product or backend evaluations, framework/team scorecards. Where a comparison table starts running out of horizontal room, radar makes the shape of each option legible at a glance
 图示
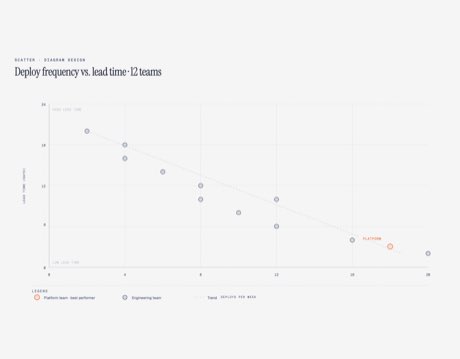
图示Scatter Plot
correlation and distribution — two continuous variables plotted against each other. Use when the relationship (or lack of one) between variables is the message, or when you need to identify clusters, outliers, and high/low performers
 图示
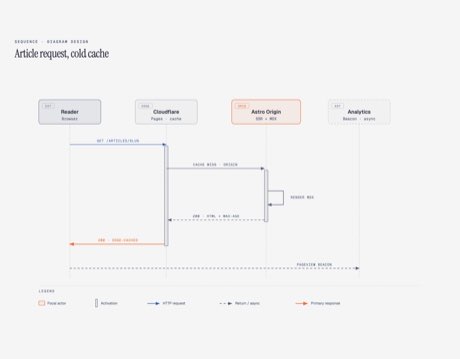
图示Sequence
request/response flows, protocol exchanges, multi-actor interactions over time, API call traces, incident reconstructions, auth/token refresh paths with branching
 图示
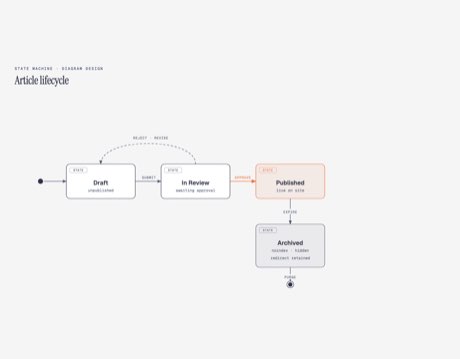
图示State Machine
finite state logic — order status, auth state, connection lifecycle, form wizard, job queue status
 图示
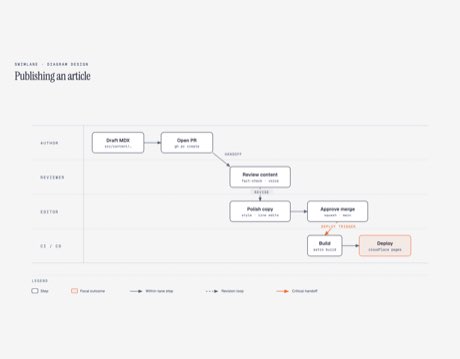
图示Swimlane
cross-functional processes, RACI-style flows, vendor handoffs, multi-team shipping workflows
 图示
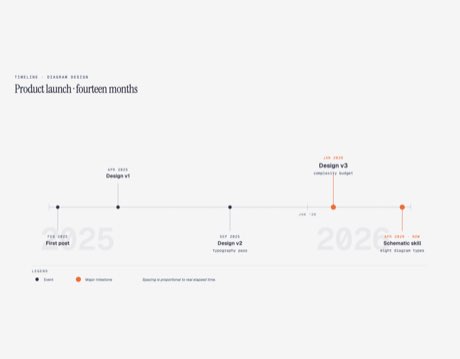
图示Timeline
release history, project milestones, incident timelines, roadmaps, changelog visualizations
 图示
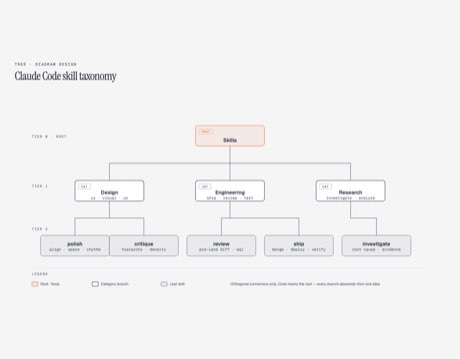
图示Tree / Hierarchy
org charts, dependency trees, taxonomy, file trees, decision breakdowns, skill trees
 图示
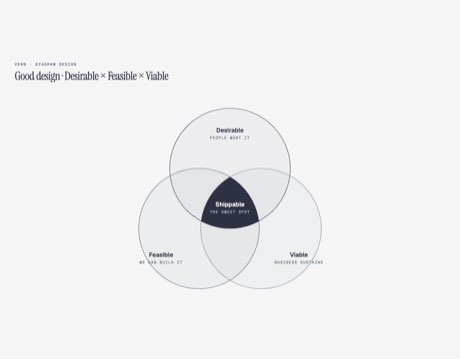
图示Venn / Set Overlap
intersection of concepts/domains, shared attributes between categories, "where A meets B", ikigai-style frames (desirable × feasible × viable)
- 数据图
- 数据图
- 数据图
- 数据图
- 数据图
- 数据图
- 数据图
- 数据图
- 数据图
- 数据图
- 数据图
- 数据图
- 数据图
- 数据图
- 数据图
- 数据图
- 数据图
- 数据图
- 数据图
- 数据图
- 数据图
- 数据图
- 数据图
- 数据图
- 数据图